
Surface roughness directly affects how a part performs in the real world. It influences friction, wear resistance, sealing capability, coating adhesion, and even fatigue life. In precision manufacturing, a small change in surface finish can mean the difference between a reliable component and early failure.
“Can I actually measure how rough this surface is without buying a $50k profilometer?”Yes, you can. But there’s a catch: you need the right software and a solid understanding of “depth of field.”
According to the international surface texture standard ISO 4287, roughness parameters such as Ra, Rz, and Rq describe the micro-scale height variation of a surface profile. While a microscope does not measure height in the same way as a contact profilometer, image-based analysis can still extract surface profile information with reasonable accuracy for many engineering applications.
Can a Metallurgical Microscope Really Measure Surface Roughness?
Yes—within limits.
A metallurgical microscope measures roughness indirectly by analyzing the optical contrast created by surface topography. Peaks reflect light differently than valleys, creating a micro-texture pattern that can be captured by a digital camera and analyzed using software.

Researchers from the National Institute of Standards and Technology (NIST) have shown that image-based surface analysis can estimate roughness values within 10–20% deviation compared to stylus measurements for certain surface ranges.
The method works best for surfaces with roughness roughly between Ra 0.1 μm and 5 μm, which covers many machining and polishing applications.
| Application | Typical Roughness Range (Ra) | Microscope Suitability |
| CNC machined aluminum | 0.8–3.2 μm | Good |
| Grinding surfaces | 0.4–1.6 μm | Good |
| Polished steel | 0.05–0.2 μm | Limited |
| Mirror optical surfaces | <0.01 μm | Not suitable |
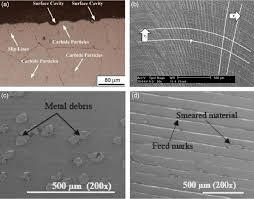
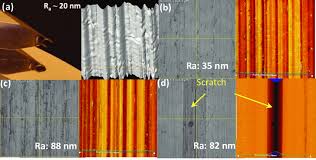
- The key advantage is that you can simultaneously inspect surface defects such as scratches, pits, or machining marks while analyzing roughness.
- However, optical microscopes are not a replacement for certified roughness instruments when strict compliance with standards like ISO 4287 or ASME B46.1 is required.
Step-by-Step: How to measure surface roughness using an optical metallurgical microscope?
First off: Equipment Setup That Actually Works
A basic metallurgical microscope setup is usually sufficient, but a few details make a big difference in measurement quality. The most important factors are magnification, lighting, and calibration.
| Component | Recommended Configuration | Why It Matters |
| Objective lens | 20× – 50× | Captures enough surface detail |
| Illumination | Brightfield or oblique light | Enhances texture contrast |
| Camera | ≥5 MP industrial camera | Prevents pixel-level measurement errors |
| Calibration slide | Stage micrometer | Converts pixels into microns |
Oblique illumination often reveals micro-grooves that are almost invisible under direct vertical light.
As surface metrology expert Dr. David Whitehouse, former editor of Surface Topography: Metrology and Properties, once noted:
“Surface texture is not only a geometric property; it is also strongly influenced by the way light interacts with the surface.”
Step-by-Step: From Lens to Data
1. The “Z-Stack” Capture
Since a microscope has a very shallow depth of field, only a tiny slice of your “rough” surface is in focus at once. You need to take a series of photos while moving the stage upward (the Z-axis) in tiny increments—usually 0.5 to 2 microns per step.
2. Software Reconstruction
You’ll need “Image Stacking” or “3D Surface Mapping” software (like MountainsMap, Helicon Focus, or proprietary brand software). The software identifies the sharpest pixels in every photo and patches them together to create a Digital Elevation Model (DEM).
3. Baseline Correction
Before reading the numbers, you must “level” the data. If your sample is sitting at a slight 1° tilt, your roughness numbers will be skewed. Use a “Least Squares Plane” filter to flatten the virtual model.
4. Extracting the Profile
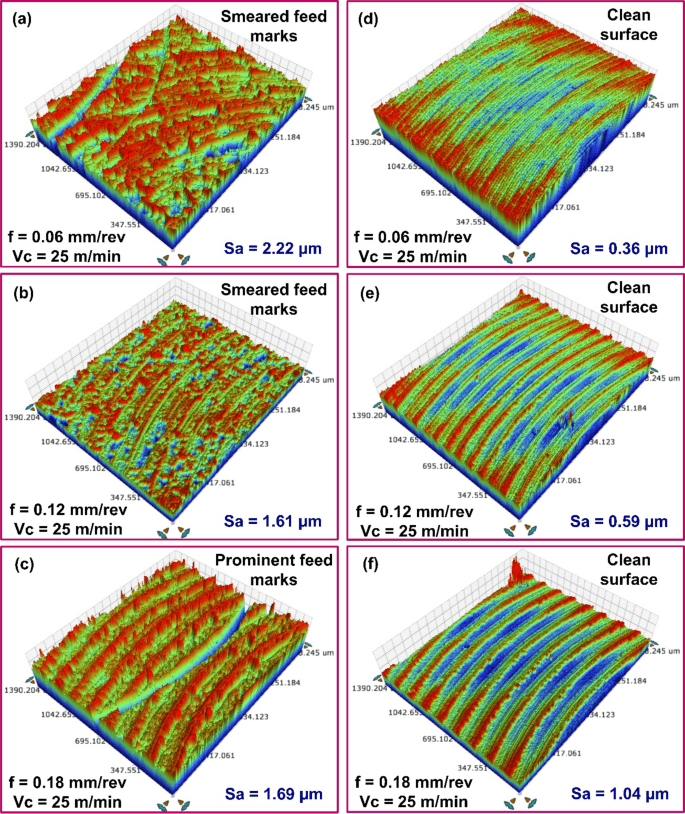
Draw a line across your 3D model. The software will generate a 2D profile curve, showing the peaks and valleys. From here, the math does the rest to give you your Ra and Rz values.
5. How Z becomes Ra
You’ll likely see two main parameters on your screen. According to ISO 25178 (the international standard for surface texture), here is what they mean for you:
- Ra (Arithmetic Average): The average of how much the surface deviates from the mean line. It’s the “all-rounder” stat.
- Rz (Mean Peak-to-Valley): The distance between the tallest peak and the lowest valley. Rz is often more useful in microscopy because it highlights scratches or pits that Ra might smooth over.
Expert Tip: “Optical measurement is sensitive to ‘noise.’ Always apply a Gaussian Filter (usually 0.8mm cut-off) to separate the true roughness from the natural waviness of the part.” — Common Lab Practice.
Accuracy vs. Reality: Is it Reliable?
Is it as accurate as a laser confocal microscope? No. But for many industrial applications, it’s “close enough.”
| Feature | Optical Microscope (Focus Stacking) | Stylus Profilometer (Contact) | Laser Confocal / White Light |
| Non-Destructive | Yes (100%) | No (Can scratch soft metals) | Yes |
| Speed | Fast (2-5 mins) | Slow (Mechanical sweep) | Very Fast |
| Z-Resolution | ~0.5 – 1.0 $\mu m$ | < 0.01 $\mu m$ | < 0.01 $\mu m$ |
| Cost | Low (if you own the scope) | Moderate | Very High |
Pro Tips for Better Data
- Kill the Glare: Use Polarized Light or DIC (Differential Interference Contrast). Metals are shiny; glare creates “fake peaks” in your software that ruin your $Ra$ calculation.
- Check your Objective: Use at least a 20x or 50x objective. A 5x lens doesn’t have enough vertical resolution to see subtle roughness.
- Stable Base: If someone is walking heavily in the hallway, your Z-stack will have “shiver” marks. Measure on a vibration-isolation table if possible.